From Jan 2014 Geoplot 3 includes a free upgrade to Geoplot 4.0 when available

Geoplot Environment

Geoplot 3.0 retains all the functionality of the previous DOS version but adds the flexibility and convenience of a Windows environment. For example you can still navigate using the keyboard, menus and shortcut keys alone, essential for field use when a mouse or other pointing device is hard to use. However, the new Windows version brings the extra versatility of a mouse pointer and fast access to commonly used features using the new toolbars for process functions, graphics and drawing. You can identify data values by scanning the mouse over a graphics plot or select new graphics or process areas using the mouse. A typical opening screen consists of : a standard menu at the top, a horizontal toolbar just underneath which gives fast access to common menu items, a process toolbar to the left, a drawing toolbar to the right, status bar at the bottom, and floating full statistics and latest history forms which can be invaluable aids for processing data. The View menu lets you turn toolbars etc on and off, though some control is also replicated on the horizontal toolbar.

There are four views you can have of opened data : graphics view, data view, history view and file details view. You can easily swap between views using the View menu or function keys. A fifth view, publish, is available for creating a published presentation of your graphics plots. A hard-copy can be made of all the views using the File menu. There is extensive control in the Options menu over how Geoplot operates and your preferred defaults for different views and forms. For example default plotting parameters, and default numeric resolution in the data view can be set. You can define what your preferred view is when you load new data  and also if previous plotting parameters or default ones are to be used. Many other options can be defined.

Data is handled in grid, master grid or composite format. A master grid defines how the individual grids lie in relationship to one another and can be used to combine individual grid data files into one file called a composite. Grids and composite files have associated with them an edit and process history respectively, as well as dimensional and other file information details. Input templates, which document data collection details and user comments, make data input rapid and easy to accomplish, and can avoid errors in the field. Files can optionally be date stamped when input, in either European or USA format, but date stamping can be turned off to avoid Year 2000 problems on older computers where the BIOS or RTC functions provide misleading information.

Data View

History View

Data may either be downloaded from Geoscan instruments via the RS232 port, manually input via the keyboard or imported via batch file transfer. Raw grid data downloaded from instruments is write-protected, preventing loss of data whilst in Geoplot. Imported data can be stored in grid or composite data format and a variety of input formats are recognised, including plain ASCII, XYZ and spreadsheet, so that data from instruments other than those made by Geoscan Research can be handled. Data can also be batch exported in a variety of formats including plain ASCII, XYZ (comma, space or tab separated), spreadsheet, Geosoft, Surfer grid files (ASCII and binary) and Grass for GIS. Generating direct Surfer grid files within Geoplot can save considerable time when using Surfer's facilities. Pseudo-section data can be exported in Res2dinv format which provides inversion facilities using the least means squares method.

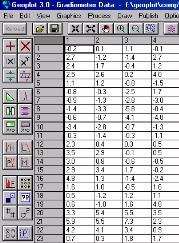
Usually you will use SVGA screen resolution or higher for desktop work but the forms have been designed for VGA use too, which can be extremely useful for data download in poor lighting conditions or where older laptop computers with VGA LCD's are to be used.

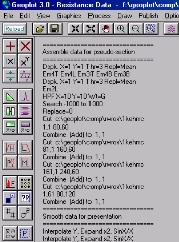
The file menu also has facilities for : combining several composites into one large composite, creating blank composites for complex data manipulation, merging FM256 dual gradiometer data, merging multiplexed parallel 0.5m/single 1m Twin data, merging of MSP40 alpha and beta data sets whilst retaining data crispness, and finally the generation of stacked pseudo-sections from expanding Twin array data sets.

Whenever an edit or process function is applied to data the default is to immediately update the current view, be it graphics, data, history or file details. The floating history and statistics forms are updated too. You can, if you wish,  turn off automatic graphics update. The Edit menu allows you to Flip Horizontal, Invert Traverse mode and directly change grid data. The Edit menu also allows you to change the North direction, change the Units and rotate both grids and composites. You can additionally document the recorded edits and processes by adding, inserting or deleting comments in the file history.

Environment    Graphics    Publishing   Hardware Requirements                                    Back to Geoplot 3.0
Processing    Upgrades and Support    Compatibility with earlier versions