|
Deslope
Removes a linear trend within a data set. It is typically used to correct for drift in gradiometer data where the use of the Zero Mean Traverse function is inappropriate.
Despike
Automatically locates and removes random spurious readings present in resistance data and locates and removes random "iron spikes" often present in gradiometer data.
Destagger
Corrects for displacement of anomalies caused by alternate zig-zag traverses which are sometimes observable in gradiometer data.
Edge Match
Used to remove grid edge discontinuities which may be present in Twin electrode resistance surveys as a result of improper placement of the remote probes.
High Pass Filter
Used to remove low frequency, large scale spatial detail, typically a slowly changing geological "background" response commonly found in resistance surveys.
Interpolate
Increases or decreases the number of data points in a survey (linear or sinx/x method). Increasing the number of data points can be used to create a smoother appearance to the data. Interpolate can also be used to make the sample and traverse intervals of differently sampled composites match, prior to combining them.
Low Pass Filter
Removes high frequency, small scale spatial detail, useful for smoothing data or for enhancing larger weak features.
Median Filter
Automatically locates and removes spurious readings present in survey data and smoothes the data at the same time. Most useful for high sample density data.
Periodic Defect Filter
Used to remove periodic features which may be present in the soil (eg plough marks) or which may be introduced as defects during gradiometer data collection.
Spectrum
Analyses the frequency spectrum of the data, splitting it into Amplitude, Phase, Real or Imaginary components. The Amplitude spectrum can be used to identify periodic defects in gradiometer data which can then be removed with the Periodic Defect filter.
Statistics
Statistical analysis of any block of data in a data set : localised mean, standard deviation, minimum, maximum and localised histogram (this is additional to the floating statistics report for the whole data set). Statistics can help determine appropriate parameters for other process functions. The report form can be positioned anywhere on screen or minimised and can be retained whilst a new data set is loaded, for statistics comparisons.
Standard Deviation or Variance Map
Replaces the data set by either the local variance or local standard deviation. A graphics plot of this new data set indicates areas of statistically different activity.
Wallis Filter
Provides histogram equalisation that emphasises low value readings and compresses high value readings.
Zero Mean Grid
Sets the background mean of each grid within a composite to zero. It is useful for removing grid edge discontinuities often found in gradiometer or similar bipolar data.
Zero Mean Traverse
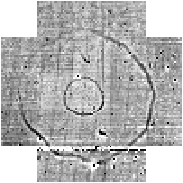
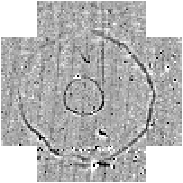
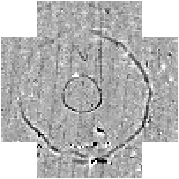
Sets the background mean of each traverse within a grid to zero. It is useful for removing striping effects in the traverse direction which can occur in gradiometer data. This also has the effect of removing grid edge discontinuities at the same time (see adjacent figures).
|
|


